
RESEARCH ARTICLE
Markers of Oxidative Stress and Inflammation in only Diabetic and Obese Ghanaian Populations: The RODAM Study
Samuel N. Darko1, 2, William K.B.A. Owiredu2, Denis Yar1, Charles Agyemang3, Erik Beune3, Juliet Addo4, Ama de Graft Aikins5, Silver Bahendeka6, Frank Mockenhaupt7, Joachim Spranger8, Peter Agyei-Baffour9, Kerstin Klipstein-Grobusch10, 11, Liam Smeeth4, Ellis Owusu-Dabo1, 9, *
Article Information

Identifiers and Pagination:
Year: 2019Volume: 9
First Page: 8
Last Page: 15
Publisher Id: TODIAJ-9-8
DOI: 10.2174/1876524601909010008
Article History:
Received Date: 04/03/2019Revision Received Date: 14/06/2019
Acceptance Date: 08/07/2019
Electronic publication date: 31/07/2019
Collection year: 2019
open-access license: This is an open access article distributed under the terms of the Creative Commons Attribution 4.0 International Public License (CC-BY 4.0), a copy of which is available at: (https://creativecommons.org/licenses/by/4.0/legalcode). This license permits unrestricted use, distribution, and reproduction in any medium, provided the original author and source are credited.
Abstract
Background:
The RODAM study has established a link between peripheral insulin resistance and varying fasting blood glucose levels among Ghanaian populations. However, associations of oxidative stress and inflammation with type 2 Diabetes Mellitus (T2DM) and obesity is yet to be assessed in this population.
Objective:
This study determined the association of inflammatory and oxidative stress markers in T2DM and obesity among Ghanaian migrants in Europe and non-migrants in Ghana.
Methods:
Socio-demographic and anthropometric variables were collected from 5350 participants of 25-70 years and stratified into migrant Ghanaians (n= 2921), urban (n=1411) and rural Ghanaians (n=1018). C-Reactive Protein (CRP), Uric Acid (UA) and ferritin were quantified and associations drawn between these markers and the metabolic disorders using logistic regression.
Results:
Overall mean ages (years) were highest for migrant Ghanaians [46.59, 95%CI (46.24, 46.93)] compared to rural [46.49 (45.72, 47.26)] and urban [45.24 (44.65, 45.83)]. CRP was associated with obesity and T2DM respectively in urban [OR=1.531, 95%CI (1.407, 1.666): OR=1.354, 95% CI (1.195, 1.535)] and migrant Ghanaians [OR=1.552, 95% CI (1.449, 1.662): OR=1.405, 95%CI (1.234, 1.600)]. Similarly, ferritin was positively associated (p<0.05) with T2DM in migrant [OR=1.312, 95% CI (1.058, 1.626)], urban [OR=1.972, 95% CI (1.510, 2.575)] and rural Ghanaians [OR=1.240, 95%CI (1.020, 1.507)].
Conclusion:
CRP and ferritin are associated with T2DM in Ghanaian populations at varying magnitudes. Moreover, indulgence in lifestyles that elevate inflammation and oxidative stress has the potential to increase risk of T2DM and obesity among Ghanaian populations.
1. INTRODUCTION
Decades of accumulated data indicate an upsurge in morbidity and mortality due to diabetes mellitus and obesity [1, 2]. This phenomenon is not only prevalent in sub-Saharan Africa but also estimated to have the highest percentage of undiagnosed cases [3]. Though, several epidemiological studies on these metabolic disorders have been conducted by various study groups, these investigations in African populations have mainly focused on the prevalence and risk factors associated with the conditions [4-6]. Consequentially, there persists a dearth in evidence on which biomarkers mediate diabetes and obesity in African populations.
Recent molecular studies have established the pathogenesis of Type 2 Diabetes Mellitus (T2DM) to be mediated by inflammatory and oxidative stress markers [7]. Immunological factors such as C-reactive protein, and the adipose tissue produced adipokines; interleukin 6 and Tumour Necrosis Factor α (TNF-α) have been found to be integral inflammatory factors strongly associated with metabolic syndrome [8]. Similarly, oxidative stress induced by biological oxidants such as serum iron and uric acid has been linked to T2DM [9, 10].
Accumulated evidence on the role of markers associated with the pathogenesis of these metabolic disorders has primarily been from Caucasian and Asian populations [11-13]. Thus there persists a dearth in the knowledge of levels and associations of biomarkers known to predict diabetes and obesity in indigenous African populations. The Research on Obesity and Diabetes among African Migrants (RODAM) was designed to assess the environmental and endogenous factors that predispose Ghanaian populations to these metabolic anomalies [14]. Although peripheral insulin resistance has been linked with varying impaired fasting blood glucose levels among sub-Saharan Africans in this study [15], the relation of oxidative stress and inflammation with diabetes and obesity, which are metabolic disorders of interest in this population, is yet to be assessed.
This objective from RODAM is to determine associations between inflammatory and oxidative stress markers, and T2DM and obesity in Ghanaian migrants and those living in urban and rural Ghana.
2. MATERIALS AND METHODS
2.1. Study Design
RODAM was a multi-centred cross-sectional study of Ghanaian populations sampled from rural and urban Ghana, Germany, the Netherlands and the United Kingdom as described by Agyemang et al. [14]. Briefly, a total of 6385 Ghanaian participants were recruited for this study from five study sites; 15 villages in Ashanti region for rural Ghana, 15 enumeration areas from Kumasi and Obuasi for urban Ghana and Ghanaian migrants from Amsterdam, Berlin and London. Ghanaian migrants were those born in Ghana and living in Europe or born in the three European sites by two Ghanaian parents. This analysis, however, uses 5,350 from the total population based on the age ranging from 25-70 years and completeness of variables analysed.
Both field data and sample collection started and ended in 2012 and 2014 respectively, with ethical approval from the of the institutions involved for Ghana, the Netherlands, Germany and the United Kingdom. All participants formally consented to the study with a written informed consent.
2.2. Questionnaire
A structured questionnaire was administered face-to-face by an interviewer to participants or self administered to record variables for age, gender, level of education, use of antihypertensive and antilipidemic drugs, alcohol consumption and smoking of tobacco. Alcohol consumption was calculated in units/week with 1 unit of alcohol equivalent to 500 ml of beer, 250 ml of wine and 80 ml of spirit. Subsequently, alcohol intake was classified as ‘non-alcohol consumer’ and ‘alcohol consumer’ based on the European Society of Hypertension/ European Society of Cardiology (ESH/ESC) guidelines for managing arterial hypertension [16]. A participant was categorised as a smoker by a positive response to the question ‘Do you smoke at all? Physical activity (PA) levels were measured with the WHO Global Physical Activity Questionnaire (GPAQ). Total PA duration was also calculated as Metabolic Equivalent Task (MET) in minutes/week from sustained sessions not less than 10 minutes [17].
2.3. Anthropometric Measurements of Adiposity
Physical body measurements were carried out with validated devices whiles strictly adhering to standardized operating procedures at all study sites. Body weight was measured with a digital scale (SECA 877, UK) to the nearest 0.1 kg after removal of footwear, heavy clothing and pocket contents. Height was recorded to the nearest 0.1 cm after measuring with participant’s Frankfort plane parallel to the floor and without footwear using a portable stadiometer (SECA 217, UK). Body Mass Index (BMI) was computed as weight in kg divided by the square of the height in meters (kg/m2). Obesity was defined as BMI ≥ 30 kg/m2.
2.4. Laboratory Analysis
Participants were asked to undergo a 12-hour fast after which sample collection was undertaken. Blood samples were drawn from the antecubital vein into serum separator tubes and immediately processed and stored at -20oC before transported to the Kumasi Centre for Collaborative Research in Tropical Medicine (KCCR), Kumasi and designated places in Germany and the United Kingdom to be stored at -80oC [14]. Subsequently, the samples were shipped for biochemical determinations at the Charite-University Medicine Berlin (Berlin, Germany). Fasting Blood Glucose (FBG) and uric acid were assayed using Glucose PAP and Uricase enzymatic colorimetry methods (ABX Pentra, France) respectively with an automated chemistry analyzer (ABX Pentra 400, France). Ferritin and CRP were determined using immunoturbidimetric assays (ABX Pentra, France). T2DM was defined according to WHO definition [18].
2.5. Data analysis
Study characteristics were expressed as proportions for categorical variables and mean (95% confidence interval) for continuous variables. Comparison of proportions between sites was by Chi-square. All variables were tested for normality and those not parametric (CRP and ferritin) were log transformed. T-test and ANOVA were used to assess the significant statistical difference between gender and study sites respectively. Post hoc pairwise comparison was done using Tukey honest significant difference test. Associations of oxidative stress and inflammatory markers with metabolic conditions were assessed using logistic regression. The Crude model was adjusted for age, sex, alcohol consumption, smoking, physical activity, education and obesity or T2DM. The level of statistical significance was set at p < 0.05 with the analysis performed using STATA 14.0 (StataCorp, USA).
3. RESULTS
3.1. Characteristics of participants
Mean age (years) of the study population was 46.22, 95%CI (45.94, 46.51) with an older male population (p < 0.05). Similarly, males reported significantly higher (p < 0.05) mean levels for glucose and ferritin and uric acid compared to females. Conversely, females had higher mean CRP and BMI levels than their male counterparts. With respect to total physical activity (MET-min/week), males were more active [7414.01, 95% CI (7029.22, 7798.80)] than females [5442.39, 95% CI (5209.68, 5675.09)]. Moreover, the male participants had a lower proportion [20.94, 95% CI (19.17, 22.70)] having no formal education compared to females [42.76, 95% CI (41.10, 44.44)].
3.2. Participants Classified as Rural, Urban and Migrant Populations
Ghanaian migrants were marginally older than rural and urban Ghanaians. Mean glucose levels (mmol/L) were highest [5.60, 95%CI (5.49, 5.72), p< 0.05] in the urban Ghanaian participants compared to rural and migrant Ghanaians. Rural Ghana reported the highest mean ferritin and CRP levels (p< 0.05) compared to both urban and migrant Ghanaians. Levels of BMI and the use of antihypertensive and antilipidemic drugs were highest among migrant Ghanaians. Participants from rural Ghana were more physically active compared to those in Europe and urban Ghana. The proportion of participants with no formal education was lowest among Ghanaian migrants.
3.3. Participants Classified as Obese
Obese (BMI ≥ 30 kg/m2) migrant Ghanaians were relatively older and had higher glucose, uric acid and BMI levels than those from rural and urban Ghana. Ferritin levels in obese rural Ghanaians were higher compared with the other two sites (Table 1). Similarly, physical activity and the use of antihypertensive and antilipidemic drugs were higher among obese migrant Ghanaians compared with those in rural and urban Ghana.
3.4. Participants Diagnosed with T2DM
Rural Ghanaians with T2DM (FBG ≥ 7.00 mmol/L) were comparatively older than their counterparts in urban Ghana and Europe. Individuals with T2DM in urban Ghana had higher levels of glucose, ferritin and CRP than migrant and rural Ghanaians (Table 1). The highest levels of uric acid and BMI were reported for T2DM migrant Ghanaians. Moreover, physical activity levels and use of antihypertensive and antilipidemic drugs were highest among migrant Ghanaians with T2DM.
3.5. Lifestyle Variables Stratified by Population
Proportion of participants involved in beer, wine and liquor consumption was significantly higher (p<0.05) among migrant Ghanaians compared to those in urban and rural Ghana (Fig. 1a-1d). Similarly, Ghanaian migrants who smoked were more compared to participants from rural and urban Ghana (Fig. 1d).
3.6. Associations of T2DM and Obesity with Uric Acid, Ferritin and CRP
Logistic regression analysis showed CRP to be significantly associated with obesity [OR=1.552, 95% CI (1.449, 1.662)] and T2DM [OR=1.405, 95% CI (1.234, 1.600)] among migrant Ghanaians after adjusting for confounders (age, sex, alcohol consumption, smoking, physical activity, education and obesity or T2DM). Similarly, ferritin was associated (p<0.05) with obesity and T2DM in the same population (Table 2) but at lower magnitudes compared with that for CRP after adjusting for confounders.
Both uric acid and CRP were associated (p<0.05) with obesity among urban Ghanaians. Ferritin was associated (p<0.05) with T2DM [OR=1.972, 95% CI (1.510, 1.666)] compared to CRP [OR=1.354, 95% CI (1.195, 2.575)].
Rural Ghana reported significant adjusted odds for CRP and both obesity [OR=1.441, 95% CI (1.217, 1.706)] and T2DM [OR=1.240, 95% CI (1.020, 1.507)]. Similarly, ferritin was significantly (p<0.05) associated with T2DM [OR=1.540, 95% CI (1.011, 2.346)].
4. DISCUSSION
This study found a positive association between CRP and both obesity and T2DM in Ghanaian populations. The magnitude of association of CRP and T2DM declined from migrant to the rural population. Ferritin was positively associated with T2DM among Ghanaians and at a higher magnitude in urban dwellers. Even though there was a consistent positive association found between uric acid and obesity in all three-population categories, its strength was weak.
Findings from several studies advance the view that low-grade inflammation is a positive correlation of both obesity and T2DM [19-22] with the predominant marker for assessing this phenomenon being CRP. This study also reports a positive association of the inflammatory marker with both obesity and T2DM among Ghanaian populations. Increasing adiposity is known to induce inflammation mediated by the production and secretion of inflammatory factors by fat cells [23]. Therefore, it can be speculated that the reported higher correlation of obesity and CRP among migrant and urban Ghanaians is mainly due to increased secretion of the inflammatory marker by fat cells in this population. Similarly, accumulated evidence show increase in visceral fat in particular from corresponding adiposity is associated with metabolic disorders such as T2DM [24, 25] which may account for the reported decline in association with CRP from a mean overweight migrant to a relatively normal rural Ghanaian population. It is however possible that varying number of years individuals had lived with T2DM could influence levels of inflammation but was not possible to determine in this study. This may have influenced the differences in the association between populations. It is also worth noting that although there is evidence of antihypertensive and antilipidemic drugs having a reducing effect on CRP levels [26, 27], this could not inhibit the association reported between T2DM and obesity and this acute phase protein among migrant Ghanaians. This may be an indication of the risk for T2DM among migrant Ghanaians being triggered by relatively lower CRP levels. Notwithstanding these data indicating associations for CRP and both obesity and T2DM, this study showed comparatively lower magnitudes for rural Ghanaians. This could be attributed to higher physical activity (Table 1) which is a modifiable factor inversely associated with high prevalence of CRP [28, 29] among rural Ghanaians. Therefore, it is possible that diets rich in anti-inflammatory agents such as fruits and green leafy vegetables could be a mitigating factor. And among this rural Ghanaian population, greater daily consumption of fruits and lower meat consumption has been reported [30].
| Variable | Total Number of Participants | Total Number of Males | Total Number of Females |
|---|---|---|---|
| No. of Participants | n=5350 | n=2136 | n=3214 |
| Age (years)* | 46.22 (45.94, 46.51) | 46.83 (46.35, 47.30) | 45.86 (45.51, 46.21) |
| Glucose (mmol/L)* | 5.39 (5.34, 5.44) | 5.49 (5.41, 5.58) | 5.32 (5.27, 5.38) |
| log Ferritin (pmol/L)* | 3.96 (3.93, 3.98) | 4.47 (4.43, 4.50) | 3.64 (3.61, 3.68) |
| Uric acid (μmol/L)* | 314.24 (312.00, 316.48) | 362.98 (359.57, 366.38) | 284.40 (281.94, 286.86) |
| log CRP (mg/L)* | -0.23 (-0.27, -0.19) | -0.57 (-0.64, -0.51) | -0.02 (-0.07, 0.04) |
| BMI (kg/m2)* | 27.24 (27.10, 27.38) | 25.29 (25.11, 25.48) | 28.42 (28.24, 28.61) |
| Physical activity levels (MET-min/week)* | 6173.83 (5967.67, 6379.98) | 7414.01 (7029.22, 7798.80) | 5442.39 (5209.68, 5675.09) |
| No formal Education (%) | 34.49 (33.22, 35.76) | 20.94 (19.17, 22.70) | 42.76 (41.10, 44.44) |
| Total Population | Migrant participants | Urban participants | Rural participants |
| No. of Participants (N=5350) | n=2921 | n=1411 | n=1018 |
| Male n (%)† | 41.58 (39.86, 43.30) | 28.66 (26.33, 30.99) | 38.83 (35.87, 41.79) |
| Age (years)† | 46.59 (46.24, 46.93) | 45.24 (44.65, 45.83) | 46.49 (45.72, 47.26) |
| Glucose (mmol/L)† | 5.36 (5.31, 5.43) | 5.60 (5.49, 5.72) | 5.15 (5.05, 5.24) |
| log Ferritin (pmol/L)† | 3.89 (3.86, 3.93) | 3.94 (3.89, 4.00) | 4.15 (4.10, 4.21) |
| Uric acid (μmol/L)† | 329.64 (326.58, 332.70) | 293.87 (289.76, 297.97) | 297.67 (292.84, 302.50) |
| log CRP (mg/L) | -0.30 (-0.35, -0.25) | -0.12 (-0.21, -0.04) | -0.17 (-0.27, -0.06) |
| BMI (kg/m2)† | 28.95 (28.77, 29.12) | 26.88 (26.61, 27.16) | 22.57 (22.31, 22.83) |
| Physical activity levels (MET-min/week)† | 6164.04 (5842.17, 6485.91) | 5553.95 (5842.17, 6485.91) | 7091.63 (6680.37, 7502.89) |
| No formal Education (%) | 21.52 (20.04, 23.01) | 43.83 (41.24, 46.43) | 58.84 (55.85, 61.84) |
| Use of antihypertensives (%)† | 28.03 (26.46, 29.59) | 10.44 (8.86, 12.01) | 6.99 (5.45, 8.55) |
| Use of antilipidemics (%)† | 7.52 (6.60, 8.43) | 0.35 (0.04, 0.65) | 0 |
| Obese | |||
| Total population | Migrant participants | Urban participants | Rural participants |
| No. of Participants (N=1405) | n=1011 | n=341 | n=53 |
| Male n (%)† | 20.54 (18.08, 23.00) | 7.32 (4.61, 10.04) | 8.77 (1.36, 16.19) |
| Age (years)† | 47.31 (46.74, 47.88) | 45.30 (44.21, 46.39) | 43.98 (41.02, 46.94) |
| Glucose (mmol/L)† | 5.19 (5.15, 5.23) | 5.12 (5.06, 5.18) | 5.12 (4.95, 5.29) |
| log Ferritin (pmol/L) | 3.74 (3.67, 3.80) | 3.68 (3.56, 3.80) | 3.92 (3.68, 4.17) |
| Uric acid (μmol/L)† | 331.47 (326.21, 336.73) | 302.63 (294.61, 310.66) | 324.99 (305.51, 344.48) |
| log CRP (mg/L) | 0.35 (0.27, 0.44) | 0.76 (0.61, 0.91) | 0.85 (0.52, 1.18) |
| BMI (kg/m2) | 33.95 (33.71, 34.12) | 33.90 (33.53, 34.27) | 33.48 (32.57, 34.39) |
| Physical activity levels (MET-min/week)† | 5724.62 (5192.73, 6256.50) | 5374.74 (4754.76, 5994.72) | 4931.37 (3533.00, 6329.74) |
| Use of antihypertensives (%)† | 31.05 (28.23, 33.87) | 13.28 (9.73, 16.82) | 12.28 (3.68, 20.88) |
| Use of antilipidemics (%)† | 6.75 (5.22, 8.28) | 0.85 (0.01, 1.80) | 0 |
| T2DM | |||
| Total population | Migrant participants | Urban participants | Rural participants |
| No. of Participants (N=195) |
n=85 | n=78 | n=32 |
| Male n (%)† | 65.21 (57.80, 72.63) | 43.55 (31.04, 56.05) | 24.00 (6.83, 41.17) |
| Age (years)† | 51.11 (49.35, 52.86) | 52.91 (20.90, 54.92) | 54.94 (51.31, 58.57) |
| Glucose (mmol/L)† | 10.23 (9.02, 11.44) | 12.74 (11.79, 13.68) | 11.10 (9.13, 13.07) |
| log Ferritin (pmol/L)† | 4.21 (4.06, 4.36) | 4.42 (4.17, 4.66) | 4.25 (3.89, 4.61) |
| Uric acid (μmol/L) | 375.63 (354.97, 396.30) | 285.85 (267.11, 304.59) | 322.82 (289.26, 356.37) |
| log CRP (mg/L)† | -0.54 (-0.77, -0.31) | 0.08 (-0.34, 0.51) | 0.12 (-0.54, 0.78) |
| BMI (kg/m2)† | 26.52 (25.97, 27.08) | 24.31 (23.59, 25.03) | 22.88 (21.32, 24.44) |
| Physical activity levels (MET-min/week)† | 6358.17 (4740.88, 7975.46) | 4663.22 (3254.07, 6072.39) | 4168.80 (2043.06, 6294.54) |
| Use of antihypertensives (%)† | 49.69 (41.90, 57.47) | 17.77 (8.11, 27.38) | 32.00 (13.25, 50.75) |
| Use of antilipidemics (%)† | 31.67 (24.43, 38.92) | 0 | 0 |
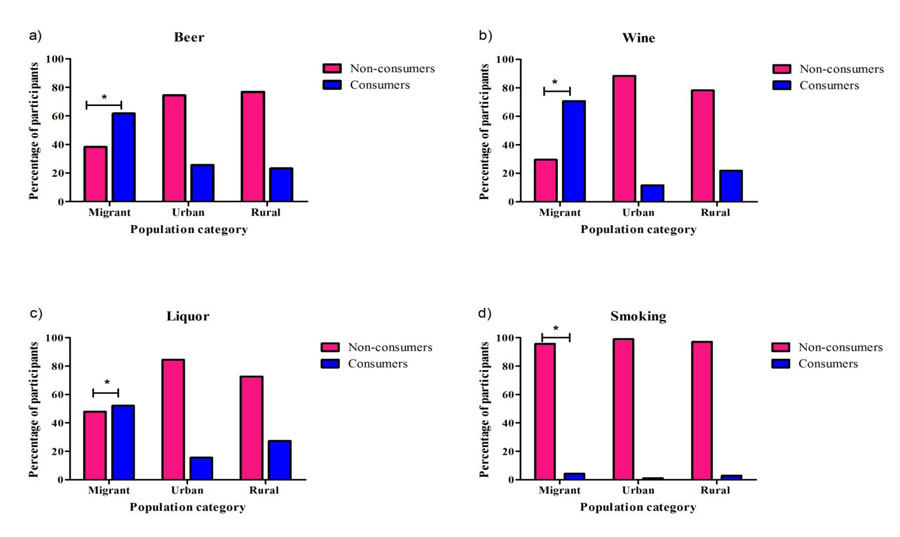 |
Fig. (1). Proportions of participants involved in alcohol consumption and smoking, stratified by population category *= P<0.05. |
| Metabolic Condition | Biomarker | Crude Model | Adjusted Model |
|---|---|---|---|
| OR (95%CI) | AOR (95%CI) | ||
| Migrants | |||
| Obesity | Uric acid | 1.000 (0.999, 1.002) | 1.006 (1.004, 1.007)* |
| - | Ferritin | 0.837 (0.781, 0.897)* | 1.130 (1.024, 1.248)* |
| - | CRP | 1.670 (1.579, 1.766)* | 1.552 (1.449, 1.662)* |
| T2DM | Uric acid | 1.005 (1.003, 1.006)* | 1.001 (0.998, 1.003) |
| - | Ferritin | 1.440 (1.227, 1.690)* | 1.312 (1.058, 1.626)* |
| - | CRP | 1.276 (1.151, 1.415)* | 1.405 (1.234, 1.600)* |
| Urban | |||
| Obesity | Uric acid | 1.002 (1.001, 1.004)* | 1.008 (1.006, 1.009)* |
| - | Ferritin | 0.764 (0.685, 0.853)* | 0.882 (0.777, 1.002) |
| - | CRP | 1.575 (1.456, 1.704)* | 1.531 (1.407, 1.666)* |
| T2DM | Uric acid | 1.000 (0.998, 1.003) | 0.997 (0.994, 1.000) |
| - | Ferritin | 2.028 (1.608, 2.557)* | 1.972 (1.510, 2.575)* |
| - | CRP | 1.408 (1.251, 1.584)* | 1.354 (1.195, 1.535)* |
| Rural | |||
| Obesity | Uric acid | 1.004 (1.001, 1.007)* | 1.010 (1.007, 1.014)* |
| - | Ferritin | 0.815 (0.619, 1.074) | 0.984 (0.707, 1.370) |
| - | CRP | 1.409 (1.213, 1.635)* | 1.441 (1.217, 1.706)* |
| T2DM | Uric acid | 1.004 (1.001, 1.008)* | 1.003 (0.999, 1.007) |
| - | Ferritin | 1.710 (1.178, 2.481)* | 1.540 (1.011, 2.346)* |
| - | CRP | 1.288 (1.073, 1.545)* | 1.240 (1.020, 1.507)* |
Ferritin as a marker of oxidative stress was independently associated with T2DM in Ghanaians with the highest magnitude reported among urban dwellers. This adds to earlier conclusions made from large prospective studies [31, 32] which indicated plasma ferritin levels as an important independent predictor of T2DM among Western and Asian populations. These previous studies reported higher magnitudes of associations for ferritin and T2DM in the same direction as reported in this study after adjustment was done for typical factors such as age, gender and lifestyle variables. It is possible that adjustment for additional variables such as ethnicity and other biochemical markers of inflammation such as adiponectin and cytokines, may have driven the variation in odds reported between this and previous studies. Although the mechanism for this relationship is unclear, most studies implicate high iron levels, which correlate with ferritin, generating reactive oxygen species that damage insulin receptors or inhibit the transcription of proteins essential in controlling glucose [33, 34]. It is worth mentioning that the twofold increase in odds of T2DM with ferritin among urban Ghanaians could be primarily attributed to diet which is highly animal product-based and known to be preferred by this population. On the other hand, previous studies have indicated cases of dietary iron overload among rural African populations as a result of the use of cooking wares having high contents of this metal [35, 36]. This may have contributed to relatively higher ferritin level among rural Ghanaians and its strength of association with T2DM reported in this study.
Increasing uric acid levels has been suggested to be a positive correlate of obesity and other metabolic syndromes [37-39]. Thishese elevations in uric acid levels are primarily results of increase in its production such as suggested in purine metabolism in adipose tissues [40, 41] and a decline in excretion observed in alcohol consumption [42]. Moreover, studies have identified an independent relationship between serum uric acid levels and leptin the gene production of obesity [43, 44]. It is plausible that the low magnitude in association between uric acid levels and obesity found in the three categories of the Ghanaian population is a result of the inherent levels of leptin as a pathogenic factor.
Not without shortcomings, the cross-sectional design of this study prevents the inference of causality of these markers to T2DM in the population. Moreover, the relatively lower numbers recorded as obese or having T2DM may have confounded some of these results. Self-reporting, which was the preferred means for assessing physical activity and fixed metabolic equivalent task costs conventionally used may have over-estimated total physical activity levels. It should further be noted that other metabolic disorders mediated by inflammation and oxidative stress as well as haematological disorders and infections which were outside the scope of this study, could have affected the reported levels of CRP, ferritin and uric acid.
CONCLUSION
CRP and ferritin are associated with T2DM in Ghanaian populations at varying magnitudes. Moreover, indulgence in lifestyles that elevate inflammation and oxidative stress has the potential to increase risk of T2DM and obesity among Ghanaian populations.
ETHICAL APPROVAL AND CONSENT TO PARTICIPATE
Ethical approval was obtained from the respective ethics committees at all sites before data collection began in each country; in Ghana (School of Medical Sciences/ Komfo Anokye Teaching Hospital Committee on Human Research, Publication & Ethical Review Board; CHRPE/AP/200/12), the Netherlands (Institutional Review Board of the AMC, University of Amsterdam), Germany (Ethics Committee of Charite-Universitatmedizin Berlin) and UK (London School of Hygiene and Tropical Medicine Research Ethics Committee).
HUMAN AND ANIMAL RIGHTS
No animals were used in this research. All human research procedures followed were in accordance with the ethical standards of the committee responsible for human experimentation (institutional and national), and with the Helsinki Declaration of 1975, as revised in 2013.
CONSENT FOR PUBLICATION
Informed consent was obtained from each participant prior to enrolment in study.
AVAILABILITY OF DATA AND MATERIALS
The data sets analysed during the current study are available from the corresponding author (E. Owusu-Dabo) on request.
FUNDING
This work was funded by the European Commission under the Framework Programme (Grant number: 278901).
CONFLICT OF INTEREST
The authors declare no conflict of interest, financial or otherwise.
ACKNOWLEDGEMENTS
SND, WKBAO, DY, CA, JA, AA, SB, PA, LS, KKG and EOD conceived and designed the study. CA, EB, JA, FM, JS and EOD carried out recruitment of participants and data collection. SND conducted the statistical analysis and drafted the manuscript. All authors contributed to the data interpretation, read and approved the final manuscript.
Authors are thankful to members of the advisory board for their guidance leading to the success of this study. We are also grateful to the Ghanaian participants who willingly took part in the study.
LIST OF ABBREVIATIONS
| CRP | = C-Reactive Protein |
| FBG | = Fasting Blood Glucose |
| PAP | = Phenol and 4-Aminophenazone |
| RODAM | = Research on Obesity and Diabetes Among African Migrants |
| TNF | = Tumour Necrosis Factor |
| T2DM | = Type 2 Diabetes Mellitus |
| UA | = Uric Acid |
| WHO | = World Health Organization |